Mood Tracking Smart Mirror with CNN and Web Interface
Machine Learning
Web Dev
Computer Vision
Python
JS
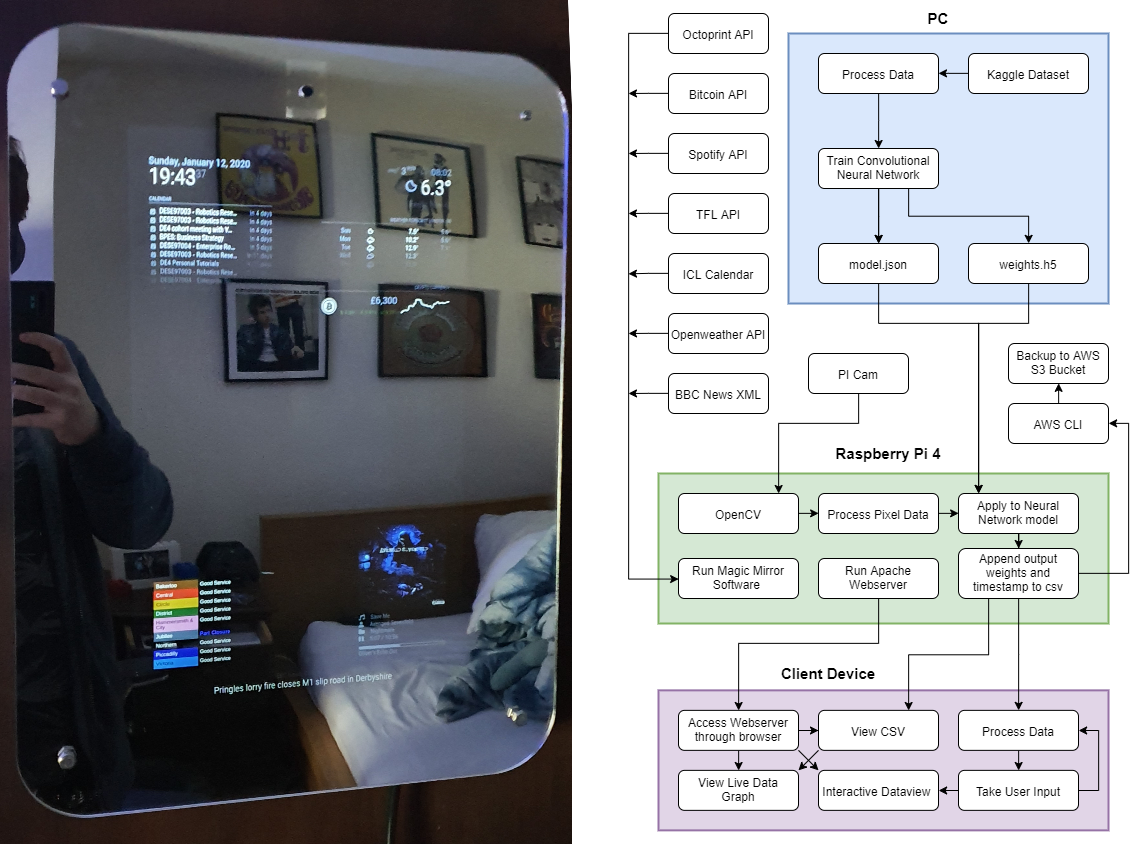
- I designed and built a mood tracking smart mirror that classifies the user's mood using computer vision and a neural network. The mirror collects data, uploads it to the cloud and plots it in real time on a web-app. The user can interact with the graphs and view data over different timescales.
How it Works
The goal of the project was to collect emotion data over 2 weeks and conduct analysis and actuation of the data. I built a smart mirror with a built in Raspberry Pi camera, this was designed to be a non obtrusive way of collecting a user's mood data. The full code is available on my Github.
Interface and Flow Diagram
Convolutional Neural Network
Python was used to process a dataset of faces using multithreading. Once the training dataset had been split into testing and training data and saved as numpy arrays, Tensorflow and Keras were used to design, train, compile nd save a convolutional neural network model.
model.add(Conv2D(num_features, kernel_size=(3, 3), activation='relu', input_shape=(width, height, 1), data_format='channels_last', kernel_regularizer=l2(0.01)))
model.add(Conv2D(num_features, kernel_size=(3, 3), activation='relu', padding='same'))
model.add(BatchNormalization())
model.add(MaxPooling2D(pool_size=(2, 2), strides=(2, 2))) #only single layer shown here
model.add(Dropout(0.5))
model.compile(loss=categorical_crossentropy, optimizer=Adam(), metrics=['accuracy'])
model.fit(X_train, y_train, batch_size=batch_size, epochs=epochs, verbose=1, validation_data=(X_test, y_test), shuffle=True)
with open("model.json", "w") as json_file:
    json_file.write(model_json)
model.save_weights("model_weights.h5")
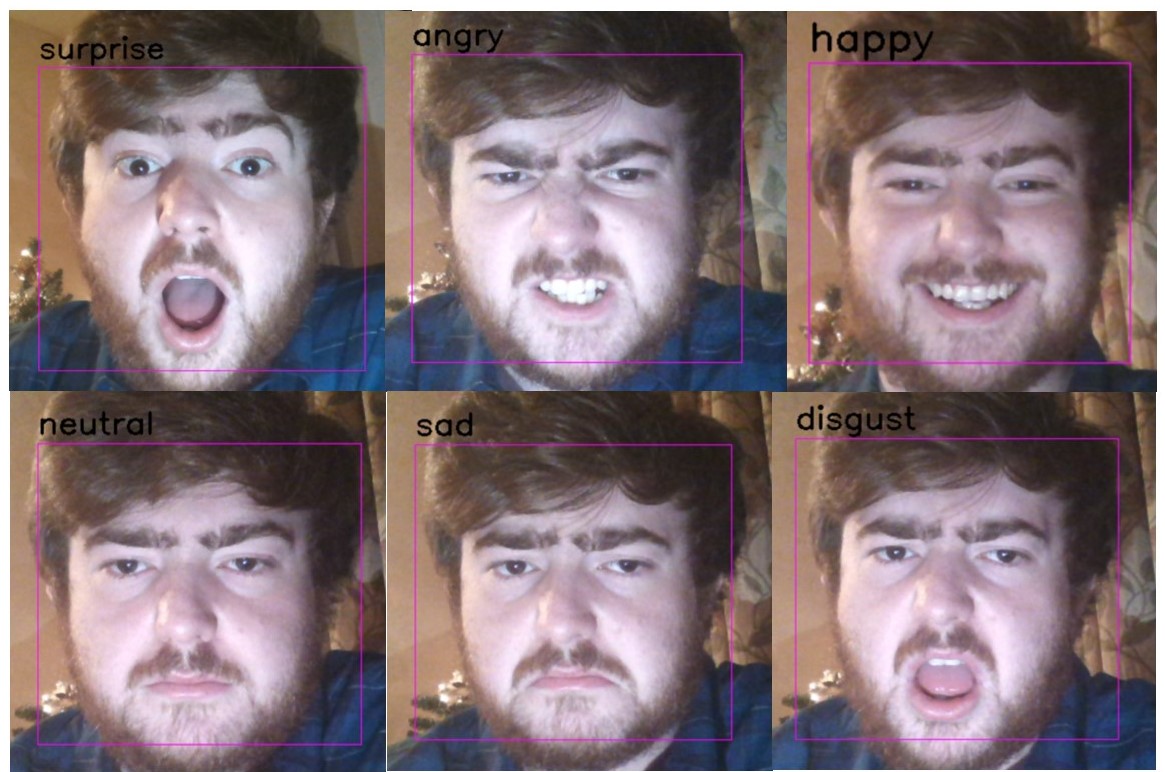
Computer Vision
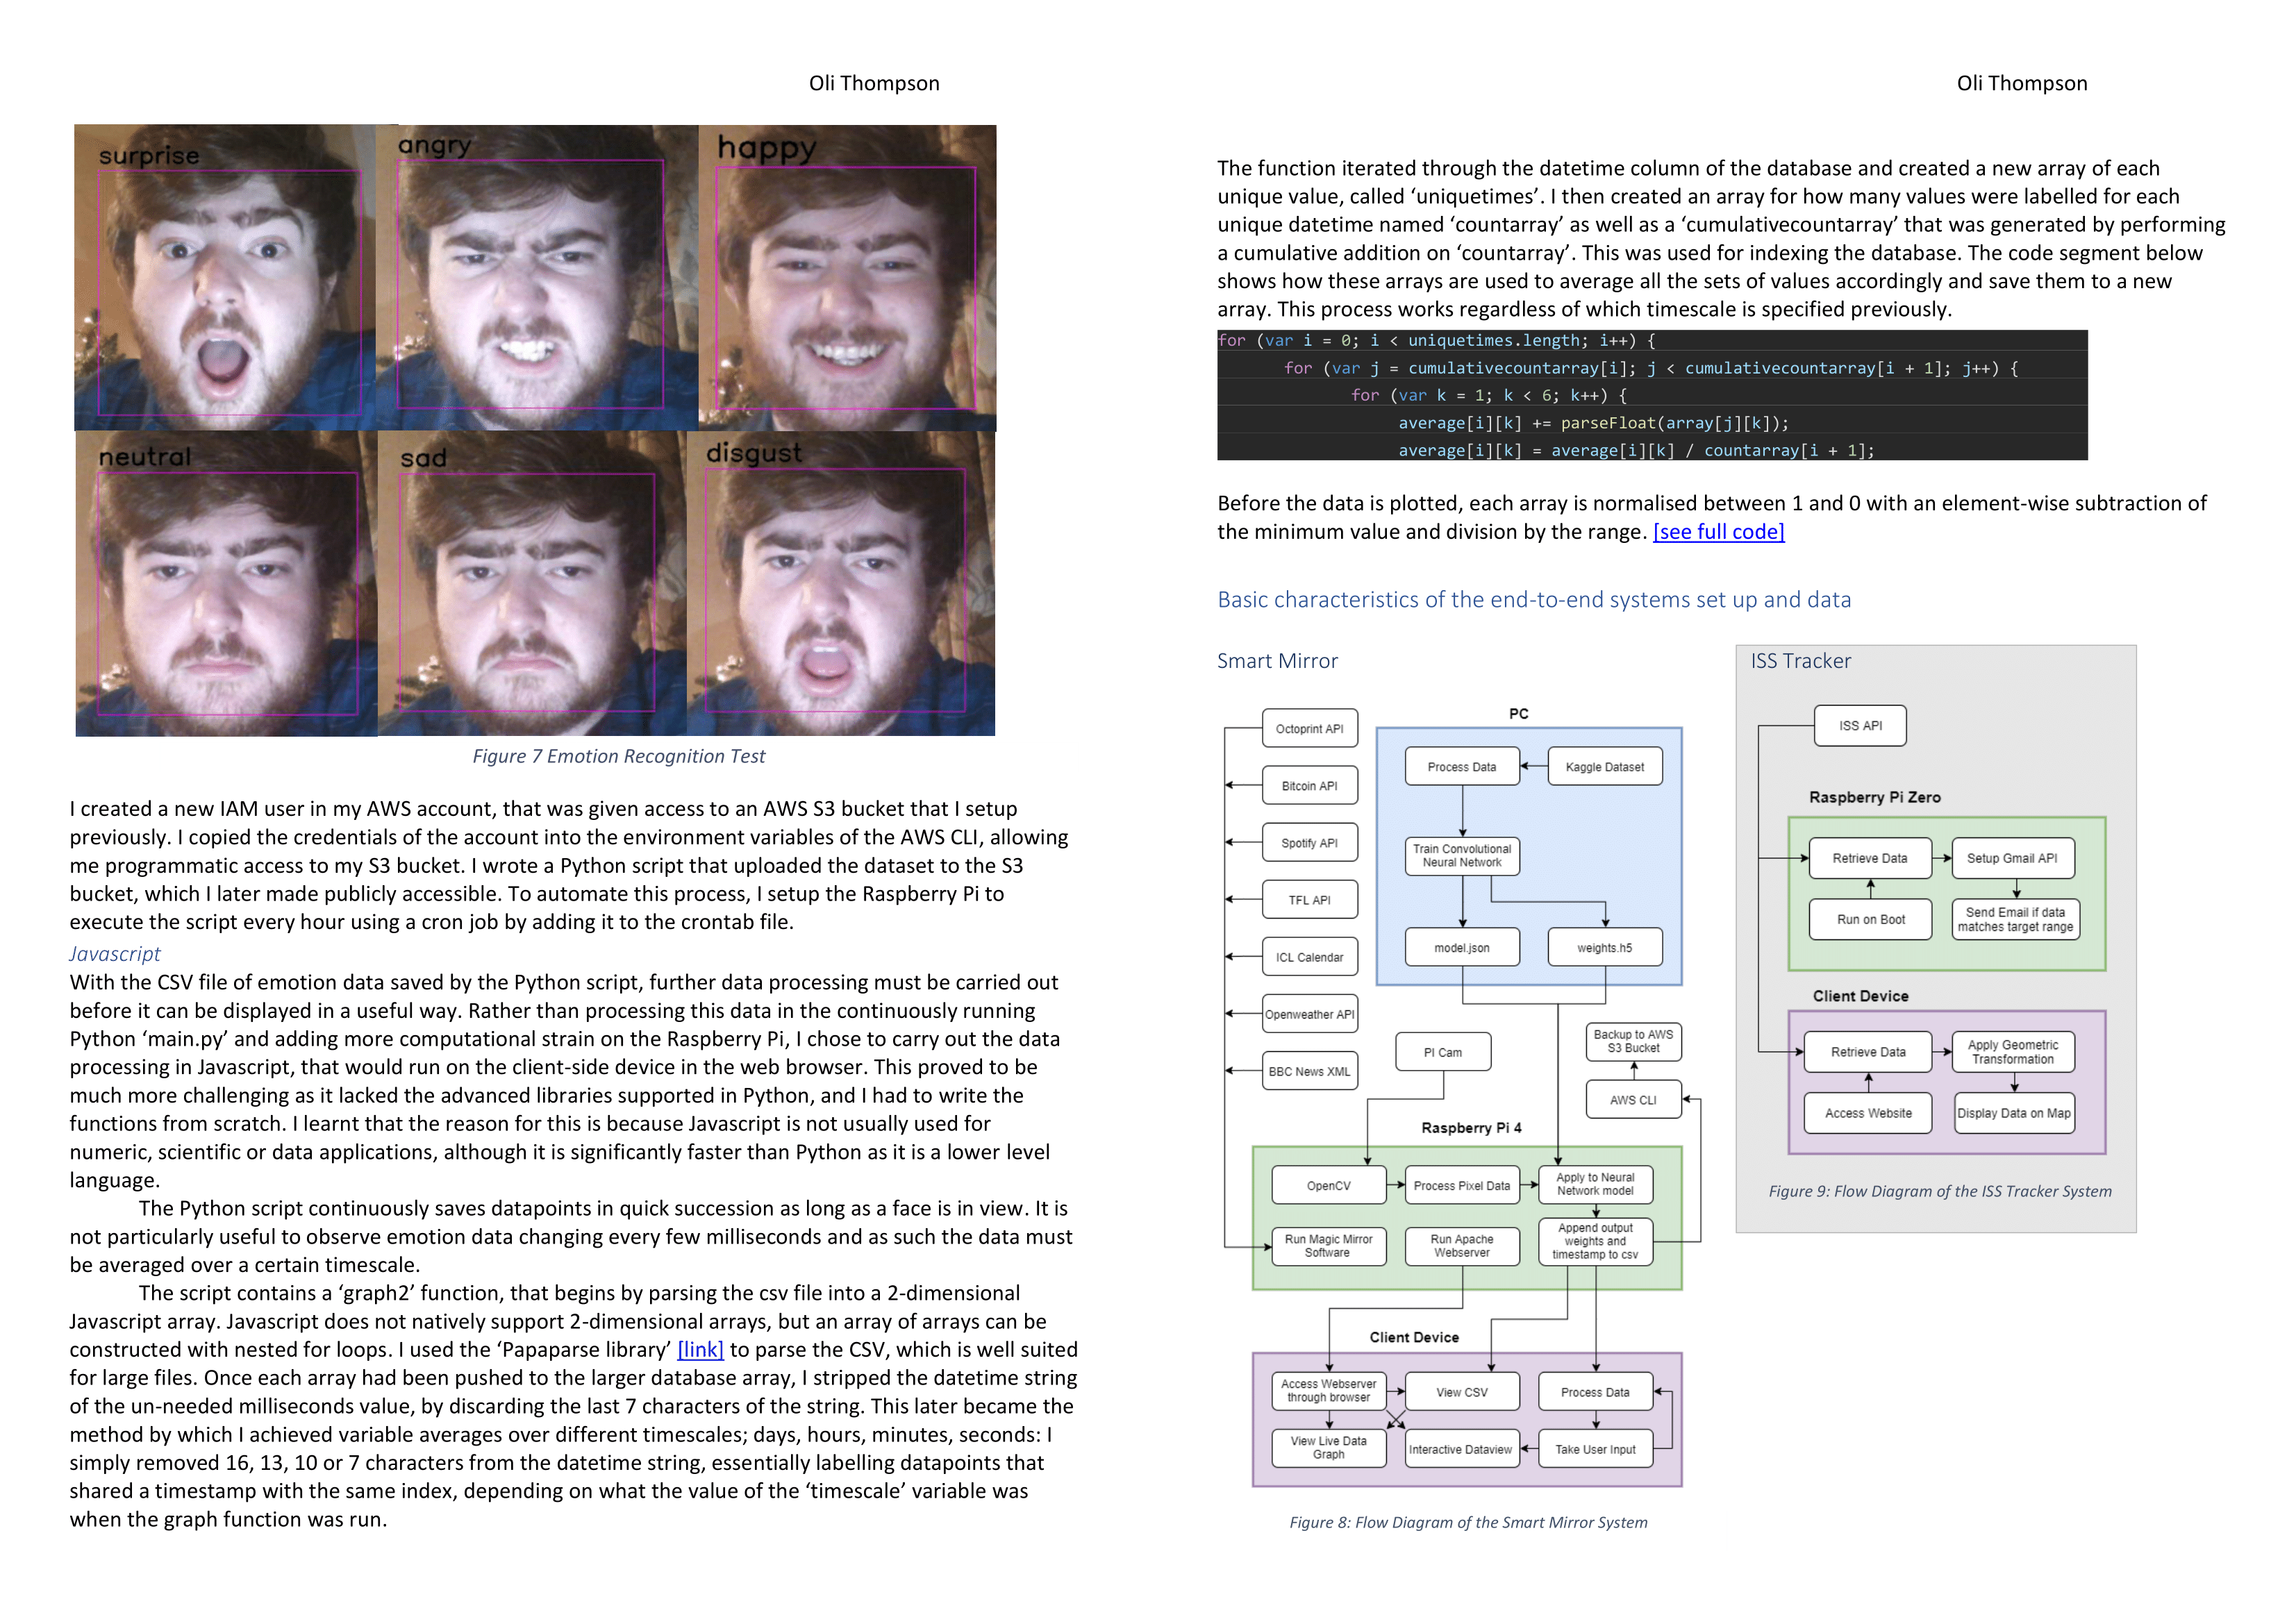
This model was transferred to the smart mirror. The code below accepts an openCV video frame. Should a face be detected, the outputs of the neural network are saved to a CSV file and uploaded periodically to an S3 bucket.
 for (x,y,w,h) in faces_detected:
            face=gray_img[y:y+w,x:x+h] #cropping region of interest
        face=cv2.resize(face,(width,height)) #resize to 48 * 48
        img_pixels = image.img_to_array(face) #create pixel array
        img_pixels = np.expand_dims(img_pixels, axis = 0)
        img_pixels = (img_pixels-min(img_pixels))/(max(img_pixels)-min(img_pixels)) #normalise data
        predictions = model.predict(img_pixels) #feed image data into CNN

        if predicted_emotion and predicted_emotion != 'neutral':
            data = {"DateTime": datetime.datetime.now(), "Angry": predictions[0,0], "Disgust": predictions[0,1], "Happy": predictions[0,3], "Sad": predictions[0,4], "Surprise": predictions[0,5], "Neutral": predictions[0,5], "Maximum Predicted Emotion": emotion[np.argmax(predictions[0])]}
            df = df.append(data, ignore_index=True)
Webserver
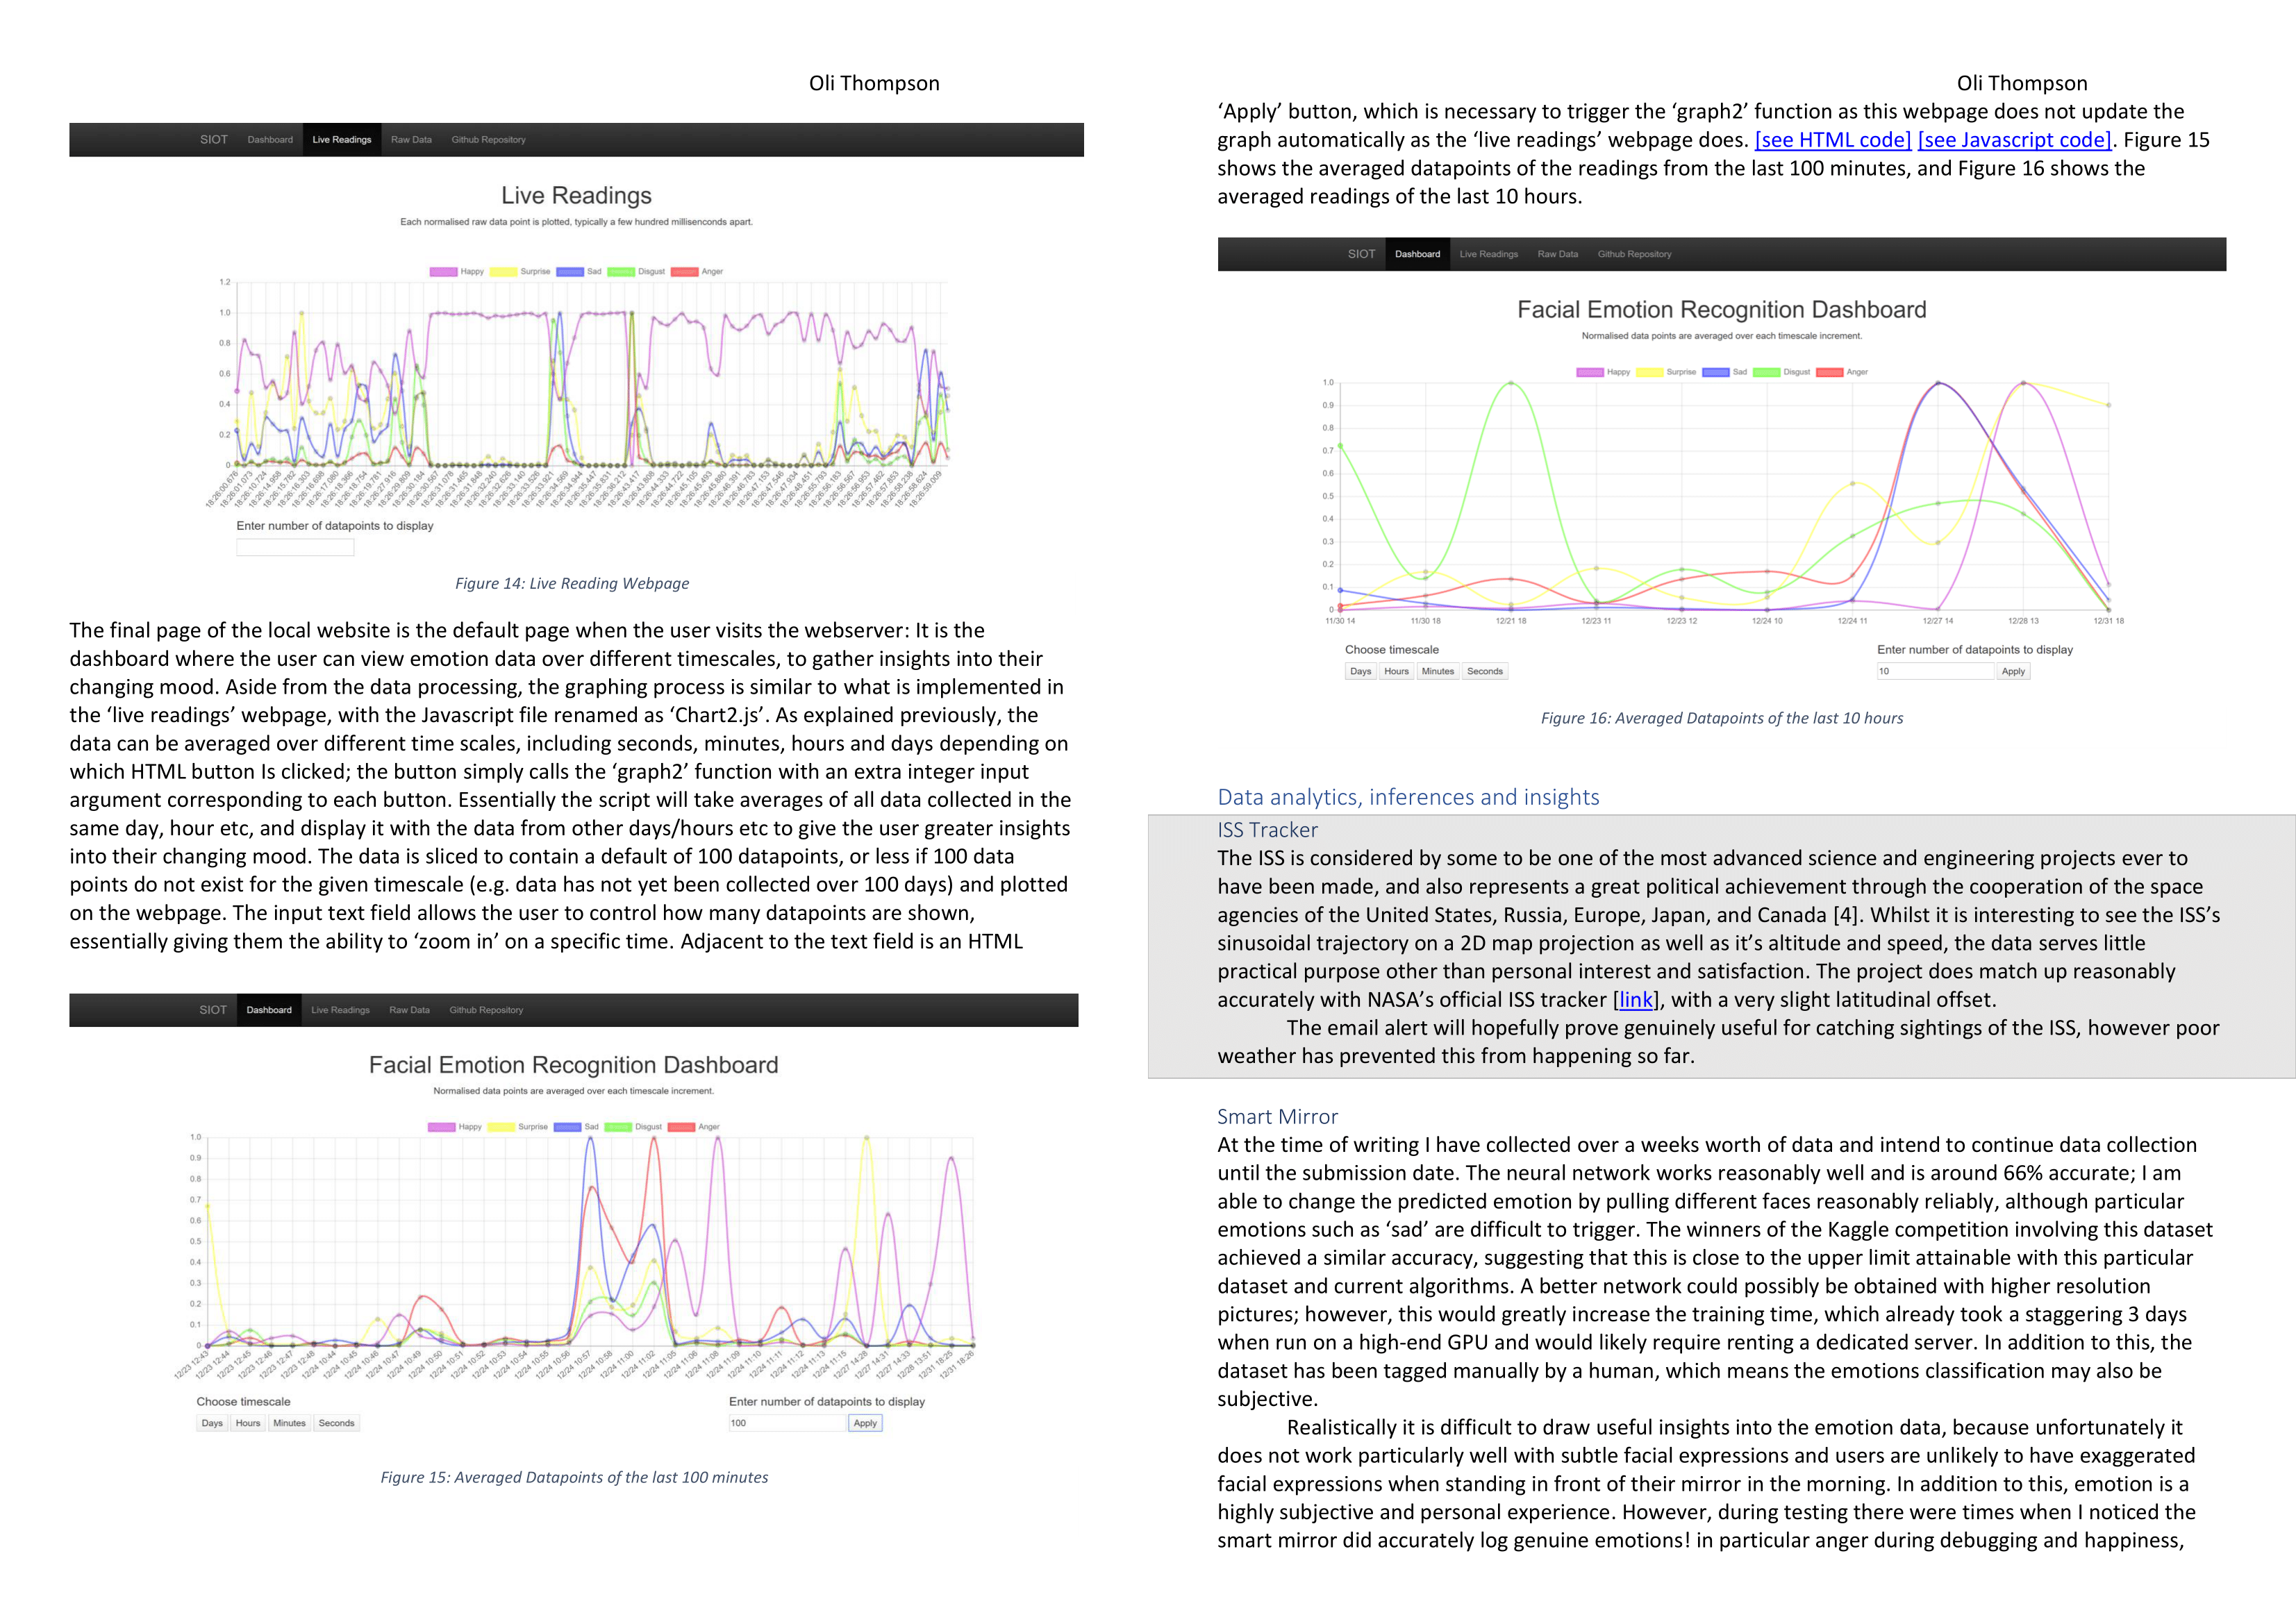
The graph below is run from the same code from the mirrors webserver but using test emotion data from a csv. The user is able to choose how many datapoints are displayed on the chart by inputting a number into the text field. By clicking on the different timescales, the data is dynamically grouped into different timescales and averaged to allow the user to view data trends over longer or shorter time periods. On the mirror's web interface this graph would update automatically when new data is collected and appended to the database.
Choose timescale
Enter number of datapoints to display
The code snippets below show how the data is parsed from the local CSV file into a Javascript array and how the data is dynamically averaged once it has been split into subarrays of unique timestamps given the value of the user defined variable 'timescale'
function graph2(timescale, datapoints) {
    Papa.parse("emotion_data.csv", {
        download: true,
        complete: function (results) {
            var data = results.dataS
            console.log("data parsed");

for (var i = 1; i < array.length - 1; i++) {
    array[i][0] = array[i][0].substring(0, array[i][0].length - parseFloat(timescale));
    array[i][0] = array[i][0].replace('-', '/');

for (var i = 0; i < uniquetimes.length; i++) {
    for (var j = cumulativecountarray[i]; j < cumulativecountarray[i + 1]; j++) {
        for (var k = 1; k < 6; k++) {
           average[i][k] += parseFloat(array[j][k]);
           average[i][k] = average[i][k] / countarray[i + 1];